

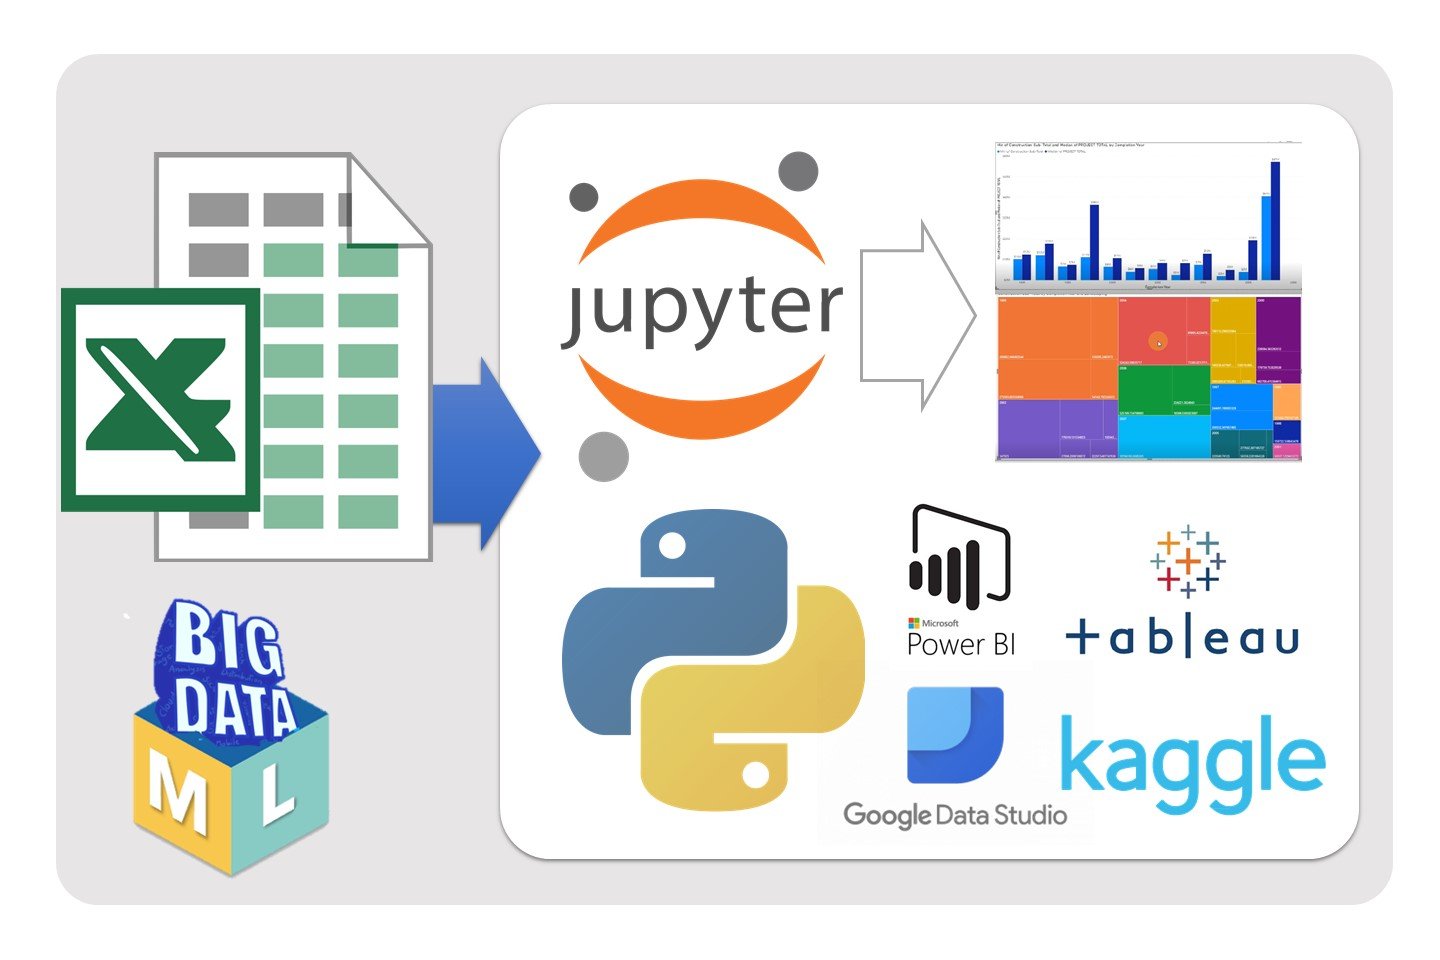
🚀 Big Data and Machine Learning in Construction

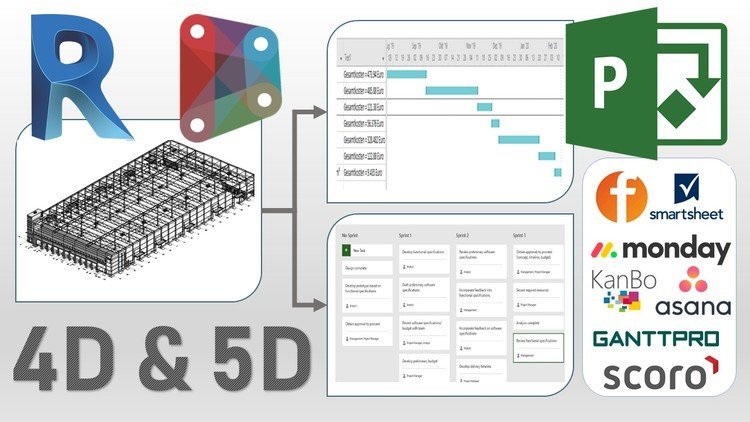
📈 BIM Courses Revit 4D & 5D

🙋🏼♂️ Words of people who learned expert skills and knowledge


Like the step by step action. It is intelligible and understandable.

+ A lot of practice (50% of the time).
+ Announced topics were considered. Besides additional materials were studied.


I learned a good new way to transfer data from a PDF Document to an Excel-Sheet.
The lessons are well structured with easy to understand examples. Many thanks to Artem for the really good explanation.

Everything is explained in a simple way and with examples. This course has been a very good starting point and showed me how data analysis and Machine Learning can be used.

Like the step by step action. It is intelligible and understandable.
50 day Money Back Guarantee
Pay conveniently via Paypal and If you are not 100% satisfied with course, you will receive a 100% refund for any reason.


🛴 Practical Step-by-Step Courses for Beginners.
During this courses we will use real data examples and go step-by-step through the main processes and cases, applicable to the construction and manufacturing industry.
This courses are for those who wants to pump up own skills and in the shortest possible period to start using Machine Learning predictions & Data Analysis at their work.
For a better understanding, courses are compartmentalized into 5 topics:

Choose the course that suits you
Each course is not tied to other courses, you can take it individually and in any order


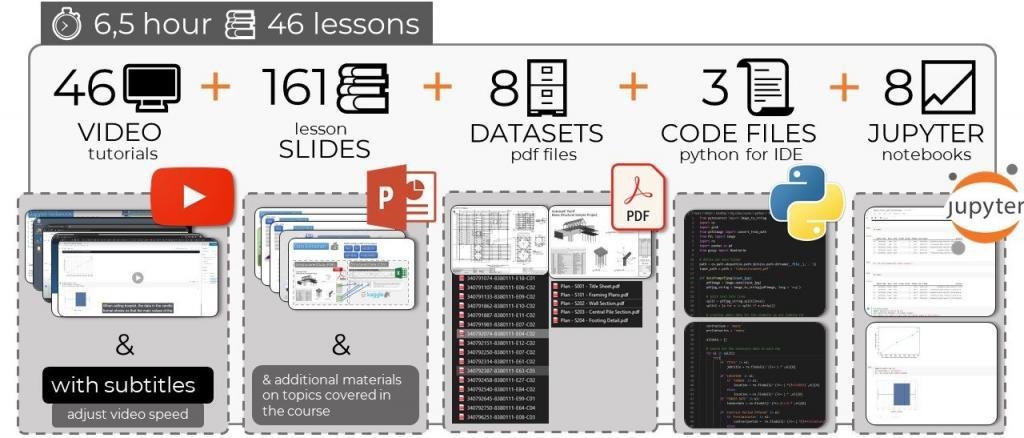
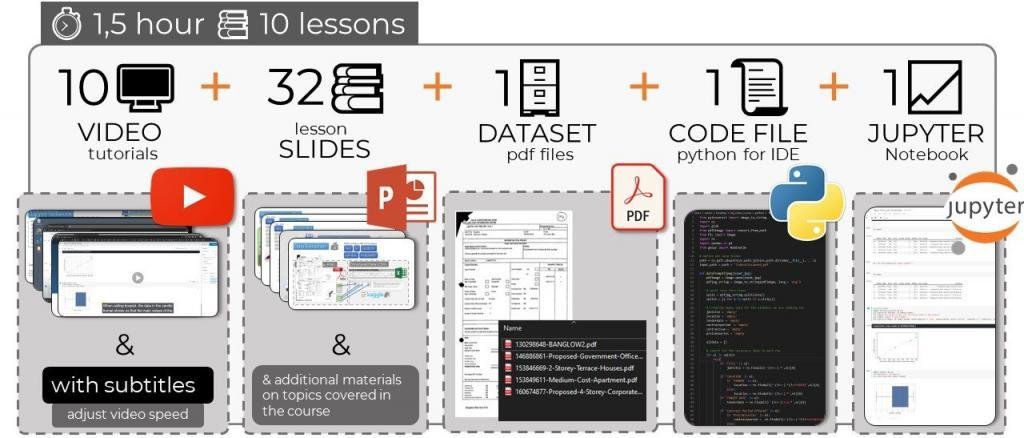
Full Course Learning Resources & Shareable Certificate

Hi, i am Artem Boiko
🏬 I am a BIM implementation specialist and I am involved in process automation in the construction industry.
✏️ On the LinkedIn platform, I write various articles about processes automation and simple engineering topics.
✋🏼 Please add me to your contacts and leave feedback about the course. I will be glad to meet new people.
📈 Level Up Your Skills
The way we work today
Work using Big Data & ML
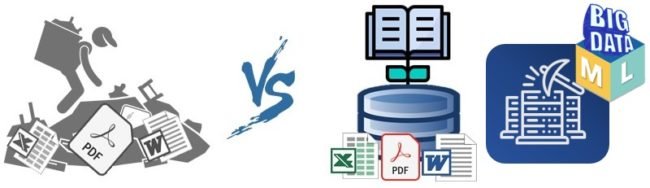
🚧 As of yet you’ve lost a huge amount of data.
🚀 But after we’ll move on to creating a database for your past projects, you’ll get access to the Big Data.
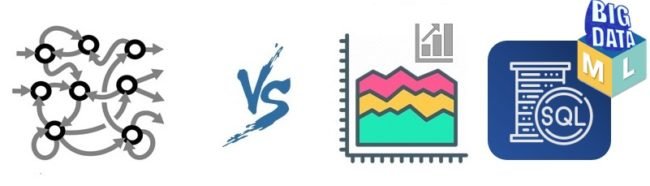
🚧 Heretofore you almost never used a data from previous projects and have lost it all.
📈 But today you can use this data as a basis for your growth.
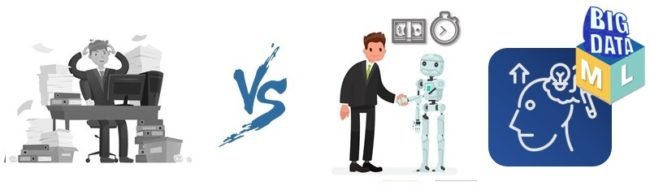
🚧 Till now you’re manually calculating the costs and time characteristics of your future projects.
🦾 But right now this kind of work can be used to perform by the machine learning algorithms.
For me “it” was hard
It was hard to find the right tools. It took a great deal of time to install the necessary components and resolve errors while the installation process itself to learn the Big Data and Machine Learning topics on my own both and working.
🚀 Thus, has borned this kits of courses for those who want step-by-step level up their skills and bring Machine Learning predictions and Big Data technology into play with a daily frequency of use.
🔎 What Will I Learn?
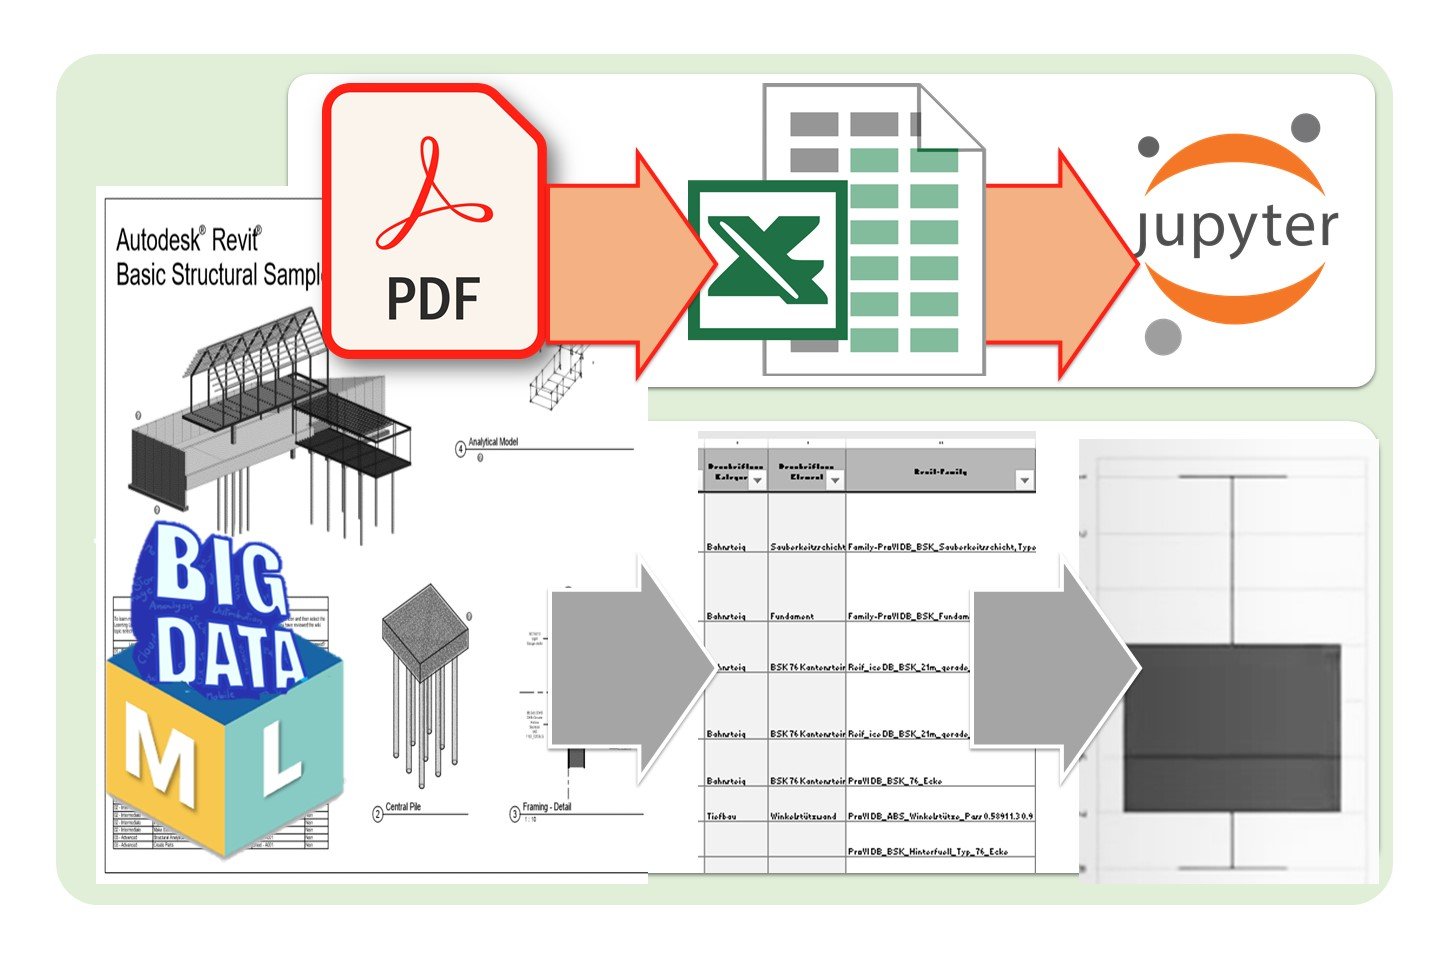
🎓 The first part is devoted to the collection and extraction of data from documents.
✔️ In this course, you will learn how to extract data from PDF documents, drawings and any other documents in PDF format.
✔️ We will work on real data. We will have two sets of data consisting of PDF files that we will transform to the text and to tabular form. We will visualize the received data on the Kaggle platform using python libraries, which will help us to depict our received data in a graphical format.
✔️ During the training process, we will install Python and such libraries as Pandas, seaborn, matplotlib and others. We will upload the received data to the Kaggle platform and here using the “Jupiter Notebook” we will visualize our data and at the end, we will upload our data to the GitHub platform.
🔎 Topics covered in this course:
📝 Lecture 2. Python. Choosing python IDE. Anaconda. Install Python.
- How to convert a PDF to text?
- Python or Anaconda?
- What is the best Python IDE for beginners?
- How do I install VS Code?
- How do I install Python?
- How to run Python in VS Code?
- How does Python interpreter choose VS code?
📝 Lecture 3. 1st Dataset. PDF files. Tika OCR. Extracting content and metadata.
- How do I convert a PDF to TXT in Python?
- How can I iterate over files in a given directory?
- Install Apache Tika on Windows.
- How to split a string into a list?
- Remove blank strings from a list?
📝 Lecture 4. Regular Expression in Python. Pattern matching in Python.
- What is regular expression with example?
- How to match regular expression in Python?
- Debug a regular expression in Python?
- What is the regular expression for date format?
- How do you check if an array contains a regular expression?
- Create loop with regular expression.
📝 Lecture 5. Array und Function in Python. Add data to Array. Create function.
- How do you add a string to an array?
- How do you find the index of an element in a list?
- How can I extract the date from a string?
- How to declare and add items to an array in Python?
- How do you write a function in Python?
📝 Lecture 6. Pandas DataFrame. Two-dimensional size-mutable, tabular data structure.
- Install pandas on Python
- How do I create a pandas DataFrame?
- Reduce number of columns in a pandas DataFrame
- Combine column values into a list in a new column
- How to convert array into DataFrame in Python?
- How to change column names in pandas Dataframe?
- Save a Dataframe as CSV table
📝 Lecture 7. Kaggle. Jupiter Notebook. Create an account. Plotting with matplotlib and seaborn.
- Upload a file to kaggle kernel
- How do you use kaggle dataset?
- Run Jupyter notebook using Kaggle kernels
- Convert a CSV to dataframe in Python Jupyter Notebook
- How to use the functions of Pandas Dataframe?
- Change the date format of a column in pandas
- How do I convert a string to datetime Objects in Python?
- Calculate Difference Between Two Dates in Pandas Dataframe
- How do I delete a column in pandas DataFrame?
- Add columns in pandas DataFrame?
- How do you visualize a dataset?
- How do you plot a DataFrame in pandas?
📝 Lecture 8. 2nd Dataset. Task. Data from PDF. Getting data from PDF drawings.
- Independent Work Tasks
- Learn to Code – on real data (16 PDF files to chart)
- A brief overview of the data in the task
📝 Lecture 9. 2nd Dataset. My solution.
- This is my solution.
- It may seem very simple and perhaps not the most effective.
📝 Lecture 10. GitHub. Desktop GitHub. Store and manage code
- What is GitHub and how do you use it?
- What can I use GitHub for?
- How do I upload files to GitHub?
- Install GitHub Desktop
- How to sync with a remote Git repository?
- Adding a repository from your local computer to GitHub
🎓 The Second part is devoted to the collection and extraction of data from scanned documents and Images.
✔️ In this course, you will learn how to extract data from From Scanned Documents And Images, invoices, receipts, contracts and any other documents in PDF format or in Image format.
✔️ We will work on real data. We will have two sets of data consisting of PDF files that we will transform to the text and to tabular form. We will visualize the received data on the Kaggle platform using python libraries, which will help us to depict our received data in a graphical format.
✔️ During the training process, we will install Python and such libraries as Pandas, seaborn, matplotlib and others. We will upload the received data to the Kaggle platform and here using the “Jupiter Notebook” we will visualize our data and at the end, we will upload our data to the GitHub platform.
🔎 Topics covered in this course:
📝 Lecture 2. Python. Choosing python IDE. Anaconda. Install Python.
- How to convert a scanned PDF to text?
- Python or Anaconda?
- Choosing an Python IDE for beginners.
- How to install Visual Studio Code on Windows?
- How to install Python?
- How to run Python in VS Code?
📝 Lecture 3. Scanned PDF files. Convert a PDF document to images using Python.
- How to convert scanned PDF to JPEG?
- How to Install Tesseract OCR?
- What is Tesseract?
- Google OCR in Python with Tesseract.
- Extract a page from a pdf as a jpeg
- How to convert a pdf document to images using python?
- Convert PDF to Image using Python.
- Install Poppler, Pillow (PIL) module.
📝 Lecture 4. Installing Tesseract. User-defined functions in Python.
- Installing Tesseract for Windows
- Install PyTesseract OCR.
- Iterate over files in a given directory.
- How is try/except used in Python?
- Writing user-defined functions in Python
📝 Lecture 5. Regular Expression in Python. Pattern matching in Python.
- What is regular expression?
- How do you match in regex?
- Online RegEx tester and debugger.
- Use Findall in Python?
- Using Regex for Text Manipulation in Python.
📝 Lecture 6. Array und Function in Python. Add data to Array. Create function in Python.
- Add a string to an array.
- How to declare and add items to an array in Python?
- Write a function in Python.
- Save data to Pandas Dataframe.
📝 Lecture 7. GeoPy – easy to locate the coordinates. Get the latitude and longitude of location.
- How do I convert address to coordinates?
- How do you geocode data?
- Locate the coordinates.
- How do I find the geocode of an address?
- Install GeoPy module.
- Install GDL, Fiona module.
📝 Lecture 8. Kaggle. Jupiter Notebook. Plot data with matplotlib, seaborn, squarify.
- Visualize a dataset.
- Run Jupyter notebook using Kaggle.
- Python Treemaps with Squarify and Matplotlib.
- How do you create a TreeMap chart?
- How to Convert Strings to Floats in Pandas DataFrame.
- Replacing strings with numbers in Python
- Plot a DataFrame with matplotlib and seaborn.
📝 Lecture 9. Folium. Mapping in Python. Plot Geographic Data on a Map.
- Plot Geographic Data on a Map.
- How to use folium with Jupyter notebook?
- Placing coordinates on a map.
- How to plot data on maps in Jupyter.
- Efficiently display a map with CircleMarker().
- Mapping in Python with geopandas.
- Black & White map with Folium.
📝 Lecture 10. GitHub. Desktop GitHub. Store and manage code.
- GitHub and how do you use it.
- Upload files to GitHub.
- Install GitHub Desktop.
- Sync with a remote Git repository.
- Adding a repository from your local computer to GitHub.
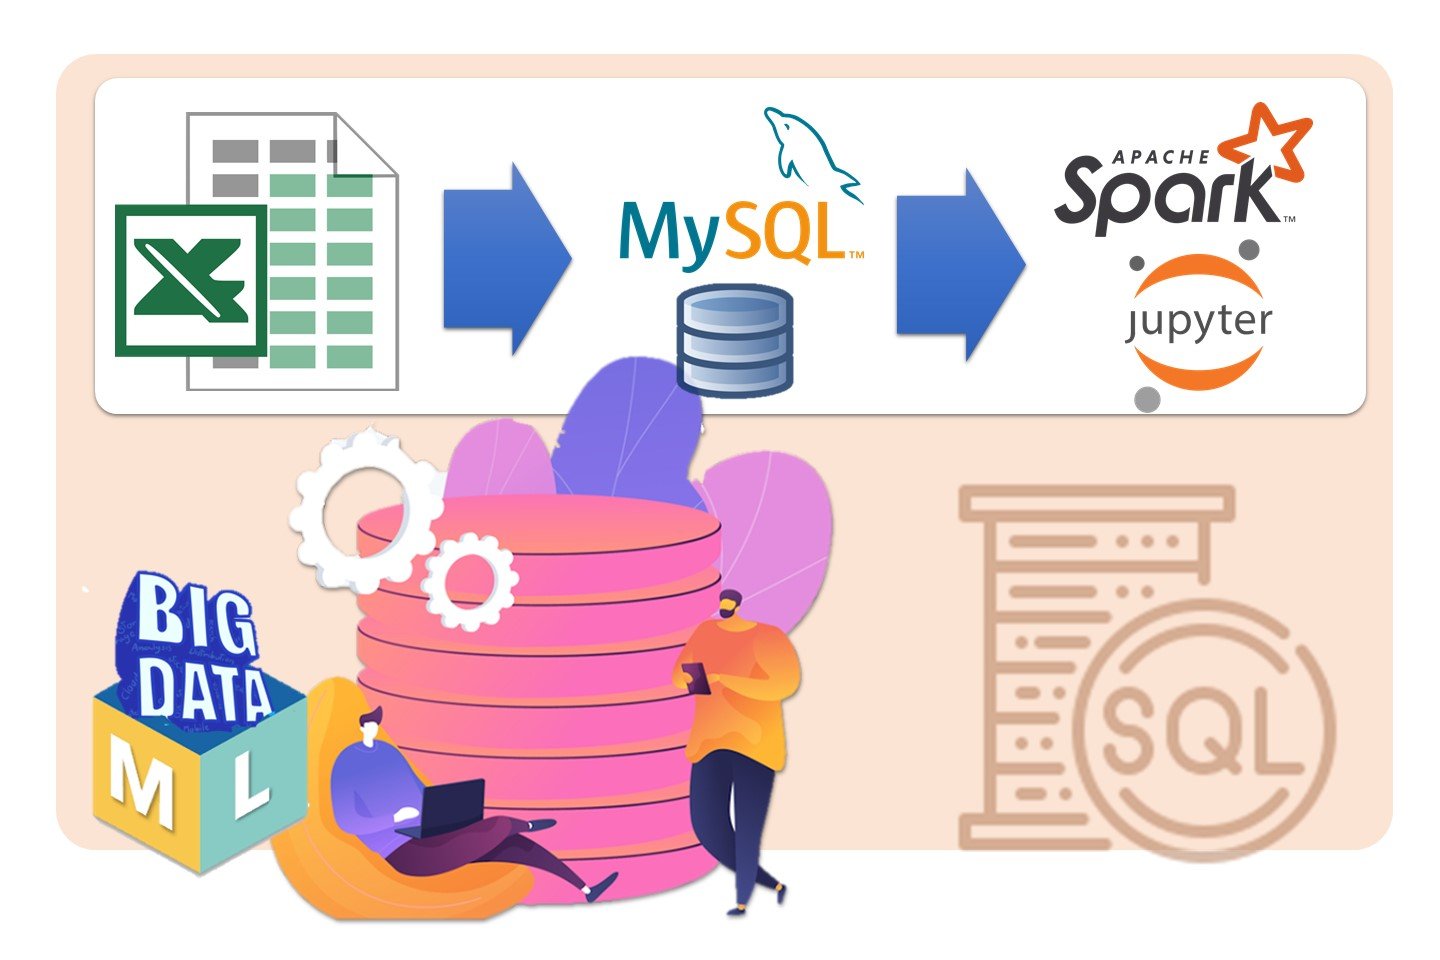
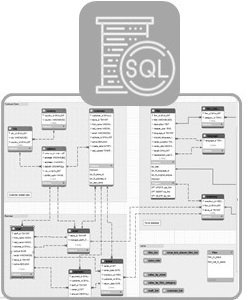
🎓 In this part we will consider the main options for storing big data.
✔️ In practical lesson we will install the MySQL server on computer and learn how to work and edit MySQL databases.
In the fifth lesson we will take one regular exel table and transfer the information from this table to the MySql server.
✔️ Then we will install the spark in order to work with datasets in a distributed manner.Then, to process the distributed data, we export the data from MySQL into spark. And with the help of Jupiter Notebook, we prepare the data for visualization of this data.
📚 In this course, you will be guided through the basics of using:
- Spark
- MySQL
- Jupyter Notebook
- Spark
🔎 Topics covered in this course:
📝 Lecture 2. Big Data Storage. Three ways to store digital data.
- What is big data?
- What storage options we have today?
- Public Cloud and Private Cloud.
- Distribute you data
📝 Lecture 3. MySql. SQL. Introduction. How it works?
- What is MySQL?
- How Does MySQL Work?
- Why is MySQL so Popular?
📝 Lecture 4. Installing and Launching MySQL Workbench. How to Get Started with MySQL Workbench.
- MySQL server setup
- Initial settings
- Getting Started with MySQL
📝 Lecture 5. Practice. Excel table into MySql. Import Excel data into a MySQL database.
- Import Excel data into a MySQL
- Create a new MySQL table.
- Most Common Queries.
- SELECT, DROP, UPDATE query mysql
📝 Lecture 6. Spark. Hadoop. Data’s Distribution. A Storage System for Big Data.
- What is Hadoop?
- Spark vs MySql
- Spark. Analytics engine for big data processing
📝 Lecture 7. Installing and Launching Apache Spark. Download and Get Started.
- Installing Apache Spark
- updating PATH environment
- Getting Started with Spark
- Launching Apache Spark
📝 Lecture 8. Practice. Connecting Python To The Spark. Get Started with PySpark and Jupyter Notebook.
- Installing Anaconda On Windows
- Running the Jupyter Notebook
- Connecting Jupyter notebook to Spark
📝 Lecture 9. Practice. Connecting MySQL with Spark. Export Data from Mysql to Spark. Distributed Computing with Spark.
- Connecting Jupyter notebook to Spark
- How to set up PySpark for your Jupyter Notebook
- Export Data from Mysql to Spark
- Importing Spark Dataframes from MySQL on Jupyter notebooks
🎓 In the fourth part we will look at the main platforms for visualizing Big Data and consider the main Data Visualization Online-Tools for Big Data.
✔️ We will briefly look at these platforms and generate several reports in each of the platforms.
This will give you the opportunity to choose the right platform that suits you and your data.
✔️ In practical lesson we exported an excel file with our data to the Kaggle platform and using a Jupyter Notebook wecleared the data and visualized the data using different python libraries.
📚 You will be guided through the basics of using:
- Jupyter Notebook
- PowerBI
- Tableu
- Google DataStudio.
🔎 Topics covered in this course:
📝 Lecture 2. Data Visualization Tools. Power BI, Tableau, Google Data Studio, Jupyter.
- What is Business Intelligence?
- Data Visualization Tools
- Was ist Business Intelligence? Was ist BI?
- Jupyter Notebooks as a Custom Calculation Engine
- Machine Learning Visualizations made in Python
📝 Lecture 3. Practice. Python Data Visualizations. Prepare Data for Visualizations. Kaggle, Jupyter Notebook (Part 1/3).
- Export data from Excel to Python
- Uploading data to Visualizations on Kaggle
- Introduction to Jupyter Notebooks
- Prepare data for Visualisations
📝 Lecture 4. Practice. Python Data Visualizations. Clean data for Visualizations (Part 2/3).
- Clean data for Visualizations
- Use Pandas in Jupyter Notebook
- Data Cleaning With Pandas
📝 Lecture 5. Practice. Python Data Visualizations. Data Visualizations in Jupyter Notebooks (Part 3/3).
- Visualization with Seaborn and Matplotlib
- Data visualization by Heatmaps and Scatter plots
- Python Treemaps with Squarify
- Three-Dimensional Plotting in Matplotlib
📝 Lecture 6. Practice. Power BI. Introduction and getting started.
- Pros and Cons of Power BI
- Import an Excel file into Power BI
- How to Get Started
- Treemaps in Power BI
- Creating Reports in Power BI
📝 Lecture 7. Practice. Tableau. Introduction and getting started.
- Pros and Cons of Tableau
- Import an Excel file into Tableu
- How to Get Started in Tableu
- Treemaps in Tableu
- Creating Reports in Tableu
- Creating Dashboards in Tableu
📝 Lecture 8. Practice. Google Data Studio. Introduction and getting started.
- Pros and Cons of Google Data Studio
- Import an Excel file into Google Data Studio
- How to Get Started in Google Data Studio
- Treemaps in Google Data Studio
- Creating Reports in Google Data Studio
- Creating Dashboards in Google Data Studio
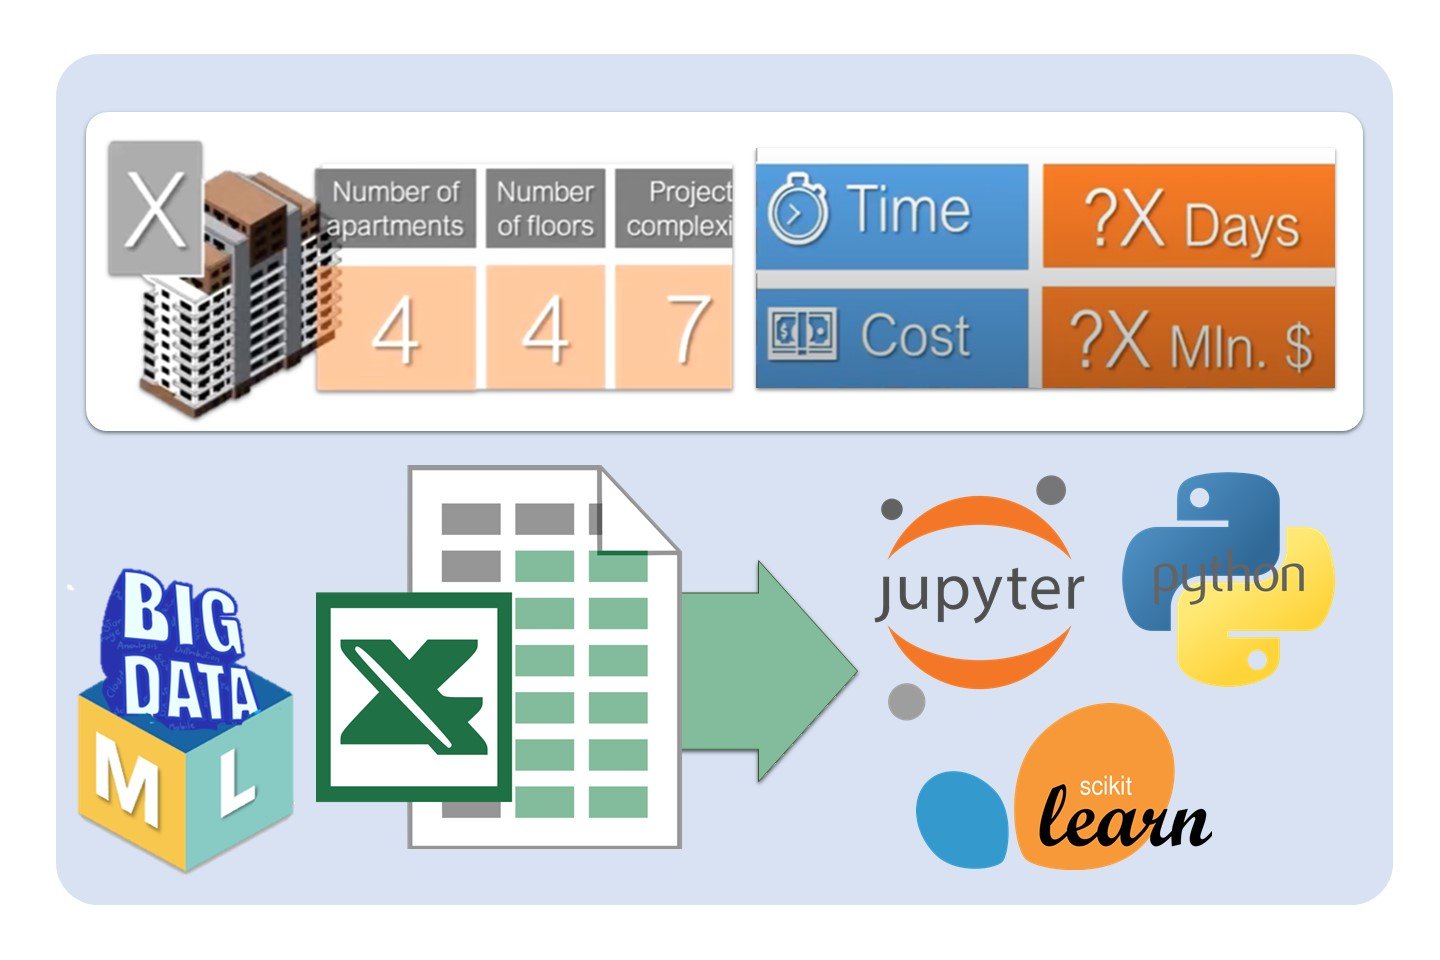
🎓 In the fifth part:
✔️ We will examine in detail the basic types, terms and algorithms of machine learning. We go through the basic concepts of machine learning that beginners need. We will consider in more detail such algorithms as K-means supervised Machine Learning, Linear Regression and other algorithms for Machine Learning.
✔️ In practical lessons we will predict the time and cost of construction for the new project X, based on the data that we collected on previous projects. And in another lesson we will predict the cost of building project X and construction time by the parameters that we will set for the new project x
✔️ Then we take open source data for the San Francisco city. We will clear this raw data and display the data in the form of a charts and maps. We will collect various interesting insights from this public information. Then we will prepare the data to create a machine learning model and try to predict some parameters from this data.
📚 You will be guided through the basics of using:
- Machine Learning Algorithms
- Jupyter Notebooks for Data Science
- K-means Machine Learning algorithm
- Machine Learning Modeling Cycle
- Linear Regression
- Build a Predictive Model
🔎 Topics covered in this course:
📝 Lecture 2. What is machine learning? Key ML Terminology.
- What is machine learning?
- Key ML Terminology
- Supervised Machine Learning
- Unsupervised Machine Learning
- Reinforcement Learning
📝 Lecture 3. Practice. Predict the price of houses. Dataset 1. Beginner’s Guide to Jupyter Notebooks for Data Science.
- Jupyter Notebooks for Data Science
- Introduction to Kaggle for Beginners in Machine Learning
- Supervised learning: predicting an output
- Predict the price of a house
📝 Lecture 4.How does machine learning work? Prediction of construction time and cost. Example of how predictions work.
- Prediction of time and cost for small training dataset
- K-means supervised Machine Learning algorithm
- Understanding K-means Clustering in Machine Learning
- Overview of Machine Learning Algorithms
📝 Lecture 5. Practice. Prediction of price and construction time. Data loading and preparation (Part 1/2).
- Getting started with Machine Learning in MS Excel
- A Kaggle Walkthrough – Cleaning Data
- Beginner’s Guide to Jupyter Notebooks
- Train, Validation Sets in Machine Learning
- Splitting data into Training & Validation
📝 Lecture 6. Practice. Prediction of price and construction time. Evaluation Metrics. Linear Regression(Part 2/2).
- Determined the cost and time of construction work for project X
- Evaluation Metrics for Machine Learning Model
- Linear Regression for Machine Learning
- How our algorithm works visually
- Creating and Visualizing Decision Trees
📝 Lecture 7. Workflow of a Machine Learning project. Stages of the Machine Learning Modeling Cycle.
- Stages of the Machine Learning Modeling Cycle
- Learning Phase of Machine Learning
- Inference from Model
- Machine Learning Deployment Pipeline
📝 Lecture 8. Practice. San Francisco – explore Building Permits Data. Data loading and preparation to Analyzing (Part 1/2).
- Find Open Datasets
- Loading large Datasets into Kaggle
- Data visualization and analysis in Kaggle
- Average postcode price on a San Francisco map
- Total cost of all building permits for the postal code
- Average “estimated cost” by type of housing
📝 Lecture 9. Practice. San Francisco – explore Building Permits Data. Cost Prediction. Way to build a Predictive Model (Part 2/2).
- Build a Predictive Model
- Training and Validation Sets: Splitting Data
- Determining the “estimated cost” by parameters
- Predict the “estimated cost” for arbitrary parameters
- Evaluation Metrics for Machine Learning Model
- Linear regression Predictive Models
📦 Learning Resources


🛴 Minimum Requirements
🎓 This Big Data and Machine Learning course is destined for beginners, but can be useful for the advanced ones as well 🛴

🚧 During the self-study, among others while installing the necessary programs and libraries, you will encounter a lot of questions and problems at every turn.
👨🏻🚀 My practical courses will save your time and effort.
💭 Get Answer with great accuracy
Machine Learning tireless companionthe smartest assistant of modern business

👩🏻🎓 Students receive 70% discount codes for all my courses

🎓 Learn With quality courses and gain new skills to
👨🏻🚀 head start a successful career

Skills & Knowledge

Suitable for all levels

Certificate
📰 Visit my blog
to be updated with the latest tips, news and course

The 📈Ups and 📉Downs of the San Francisco Construction Industry. Trends and History of the Construction

⏳ ONE HOUR work – in ONE MINUTE. Revit – Smart Planning with Dynamo.

